cutoffvalue: Determine parameters to generate curves and a graph
Lea R Medeiros
2025-08-21
FitParameters.RmdUsing the fitparams function to produce a basic
histogram and associated parameters
The fitparams function will produce a basic histogram
from the dataset, which is then used to generate certain parameters for
the curve fitting functions in subsequent functions. It assumes you have
installed the cutoffvalue package and loaded the necessary packages (see
the Getting Started vignette for more information). If you need help on
other topics, please see either the main vignette (Help) or refer to the
vignette for another topic.
If nothing is specified (i.e., only “fitparams()” is typed into the console), this function will use an internal dataset object identified as “cutoffvalue:::exampledata” as the default dataset.
The fitparams function returns a list of values to the
Environment that are used in subsequent functions. As such, you should
alter the number of breaks to produce a graph representative of what you
would like to see in the final plot - if not specified, the default is
15.
fit <- fitparams(cutoffvalue:::exampledata, breaks = 15)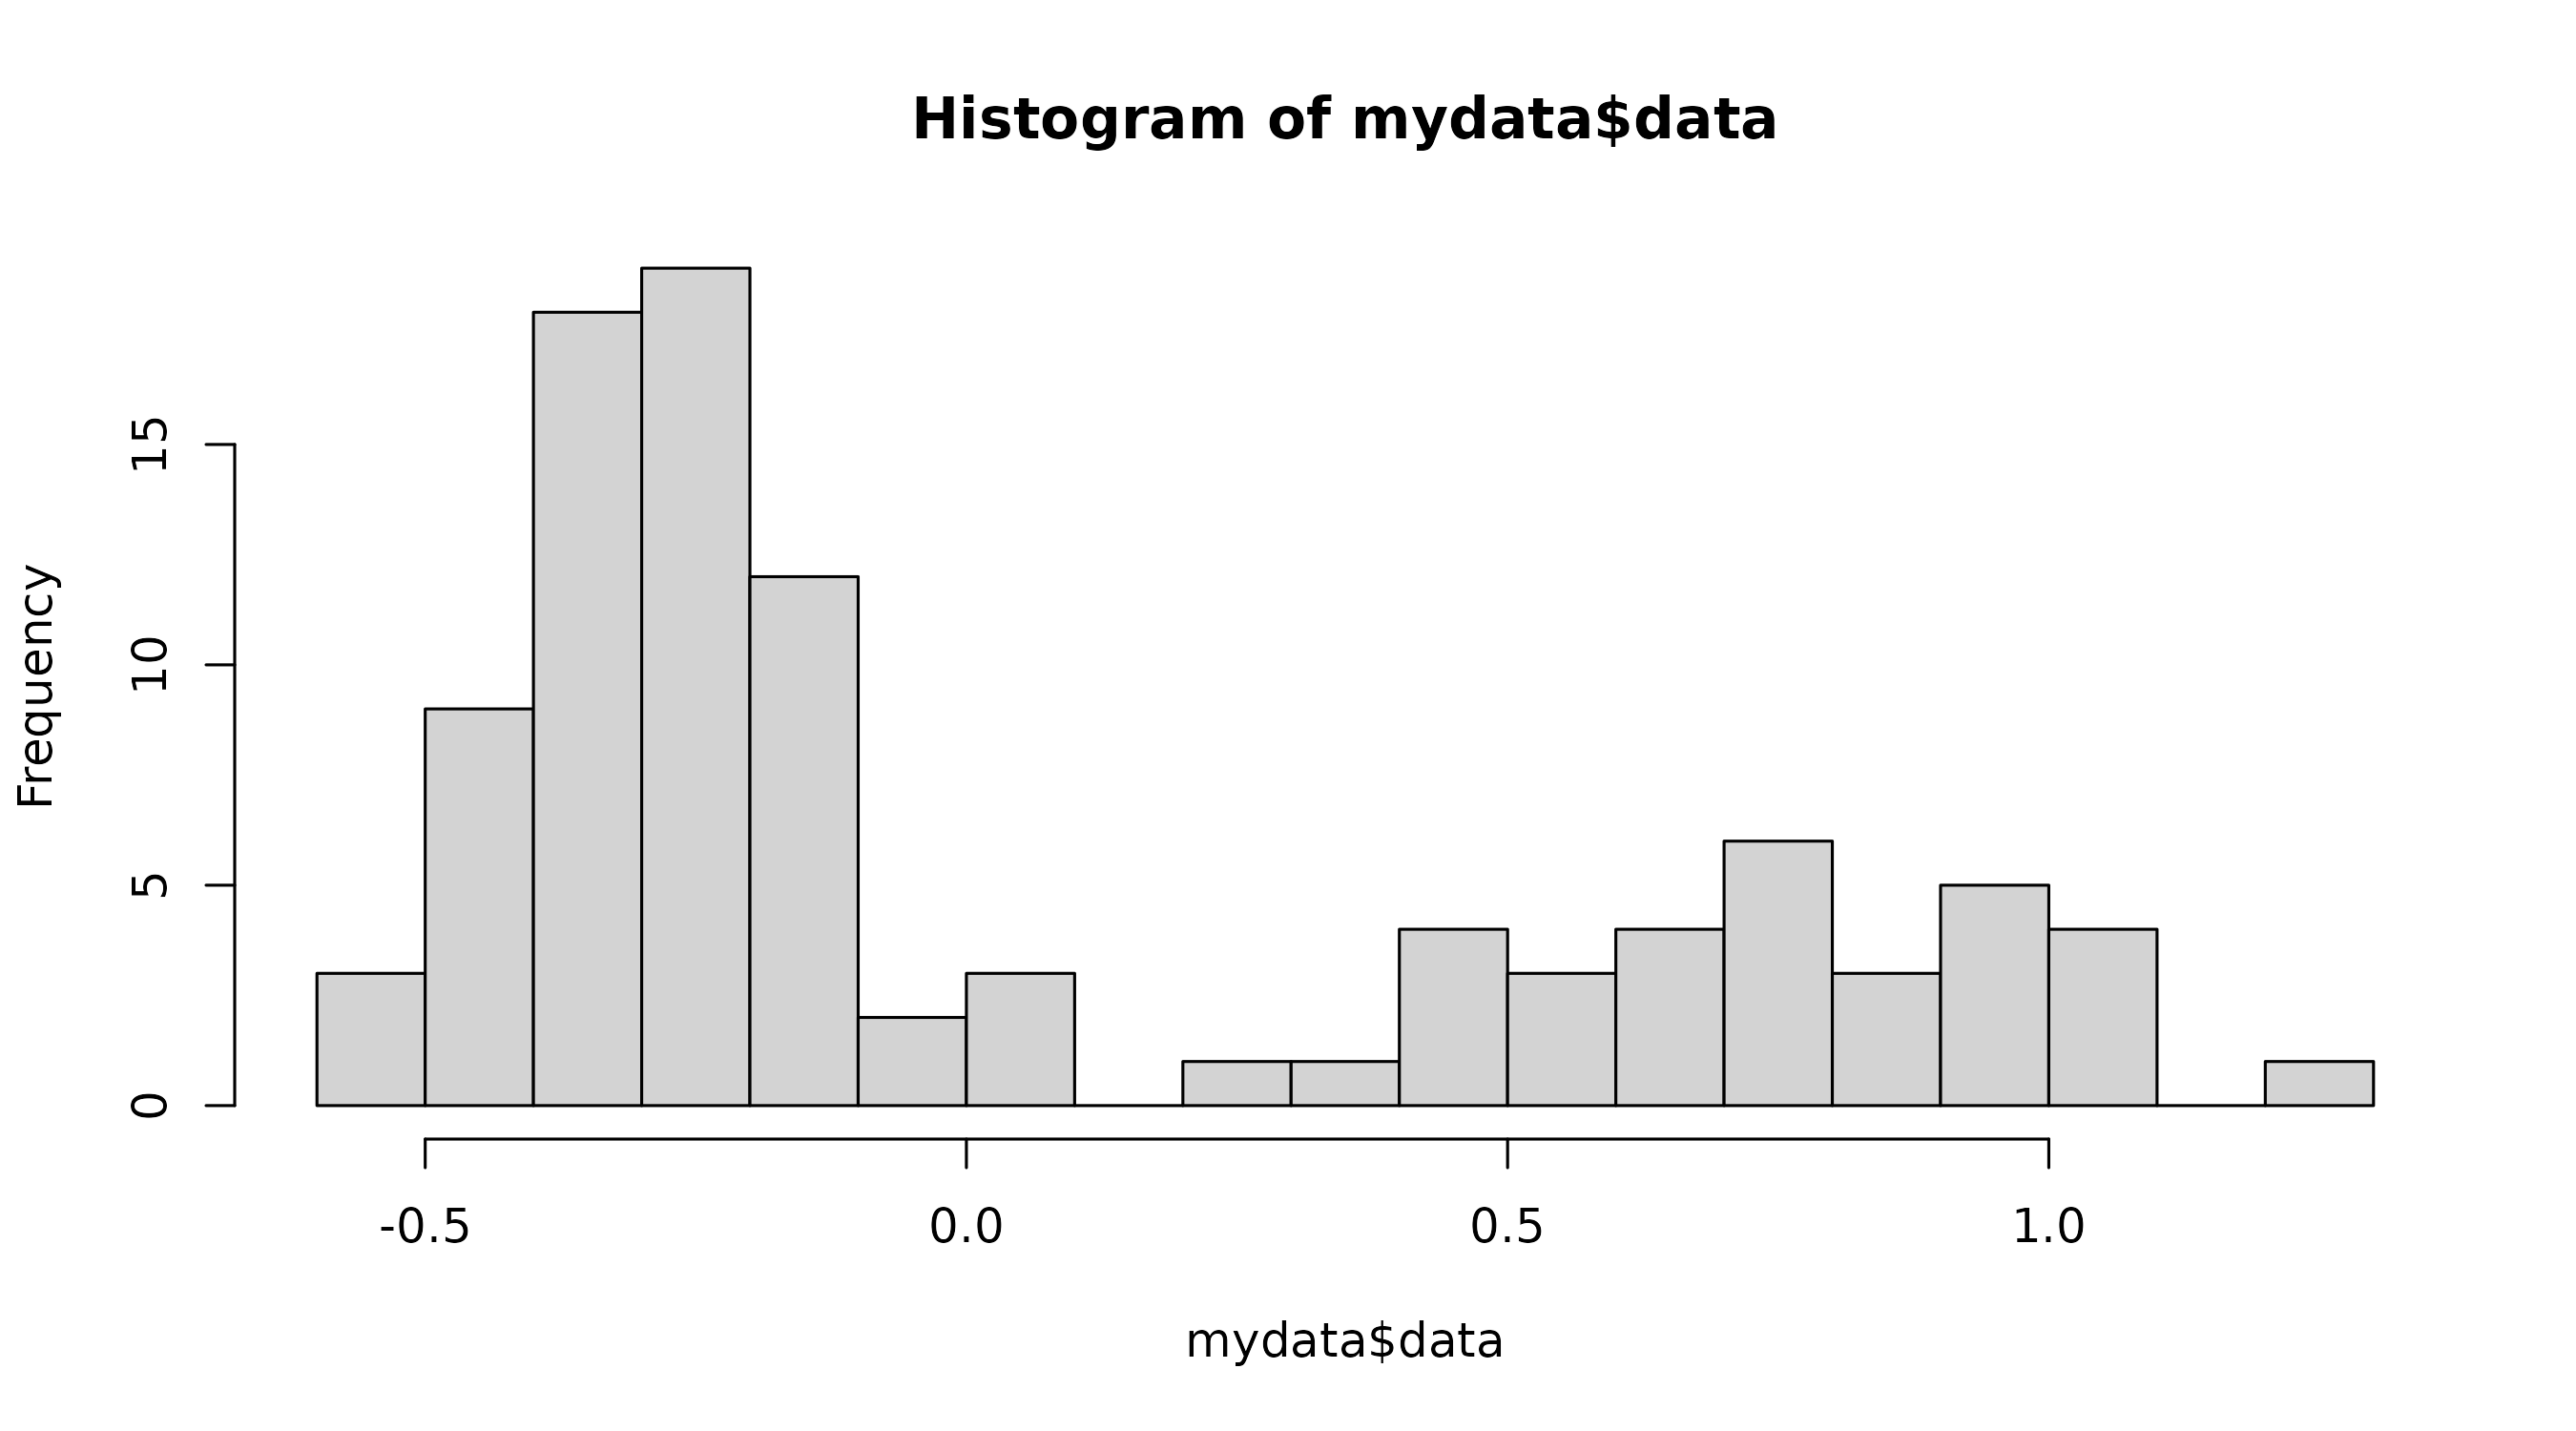
This histogram should be a general outline of what you would like the histogram in the final plot to look like. If it is not, change the number of breaks until it is. The scale of the axes in the final graph will better represent your dataset, so don’t worry about those.